A UX study on how patients read health checkup results, where interpretation breaks down, and how report information can be restructured before moving into UI redesign. ออกแบบประสบการณ์การอ่านรายงานผลตรวจสุขภาพใหม่ ให้คนไข้เห็นค่าที่ควรสนใจก่อน เข้าใจความหมายของผลตรวจ และรู้ว่าผลตรวจค่าใด ควรให้ความสนใจ และติดตาม โดยอ้างอิงจากรายงานจริง การสัมภาษณ์ผู้ใช้ และการจัดโครงสร้างข้อมูลใหม่ก่อนออกแบบ UI
Analyzed health checkup reports from 4 hospitals and interviewed real users to find recurring problem patterns, then used them as the foundation for the design. เริ่มจากการวิเคราะห์รายงานสุขภาพจากโรงพยาบาล 4 ฉบับ และสัมภาษณ์ผู้ใช้จริง เพื่อดูว่าคนอ่านติดตรงไหน เข้าใจผิดตรงไหน และต้องการความช่วยเหลือแบบใดจากรายงาน
- Analyzed and compared health checkup reports from 4 hospitalsวิเคราะห์และเปรียบเทียบใบตรวจสุขภาพจากโรงพยาบาล 4 ฉบับ
- Compared how each report presents information, orders sections, and explains resultsเปรียบเทียบรูปแบบการนำเสนอข้อมูล ลำดับการแสดงผล และการอธิบายผลตรวจ
- 4 users completed an online surveyผู้ใช้งาน 4 คนตอบแบบสอบถามออนไลน์
- Selected 2 participants for in-depth interviewsคัดเลือกผู้เข้าร่วม 2 คนเพื่อสัมภาษณ์เชิงลึก
- Asked participants to walk through how they read, interpreted, and acted on their resultsให้ผู้ใช้อธิบายลำดับการอ่าน การตีความผลตรวจ และสิ่งที่ทำหลังได้รับผลตรวจ
- Synthesized the data into findings and recurring problem patternsวิเคราะห์ข้อมูลเพื่อสรุปข้อค้นพบและรูปแบบของปัญหาที่เกิดซ้ำ
- Male, 34 - follow-up checkup for an ongoing conditionเพศชาย อายุ 34 ปี - ตรวจสุขภาพติดตามอาการ
- Male, 39 - annual checkupเพศชาย อายุ 39 ปี - ตรวจสุขภาพประจำปี
- Female, 38 - annual checkupเพศหญิง อายุ 38 ปี - ตรวจสุขภาพประจำปี
- Female, 73 - monitoring a chronic conditionเพศหญิง อายุ 73 ปี - ติดตามโรคประจำตัว
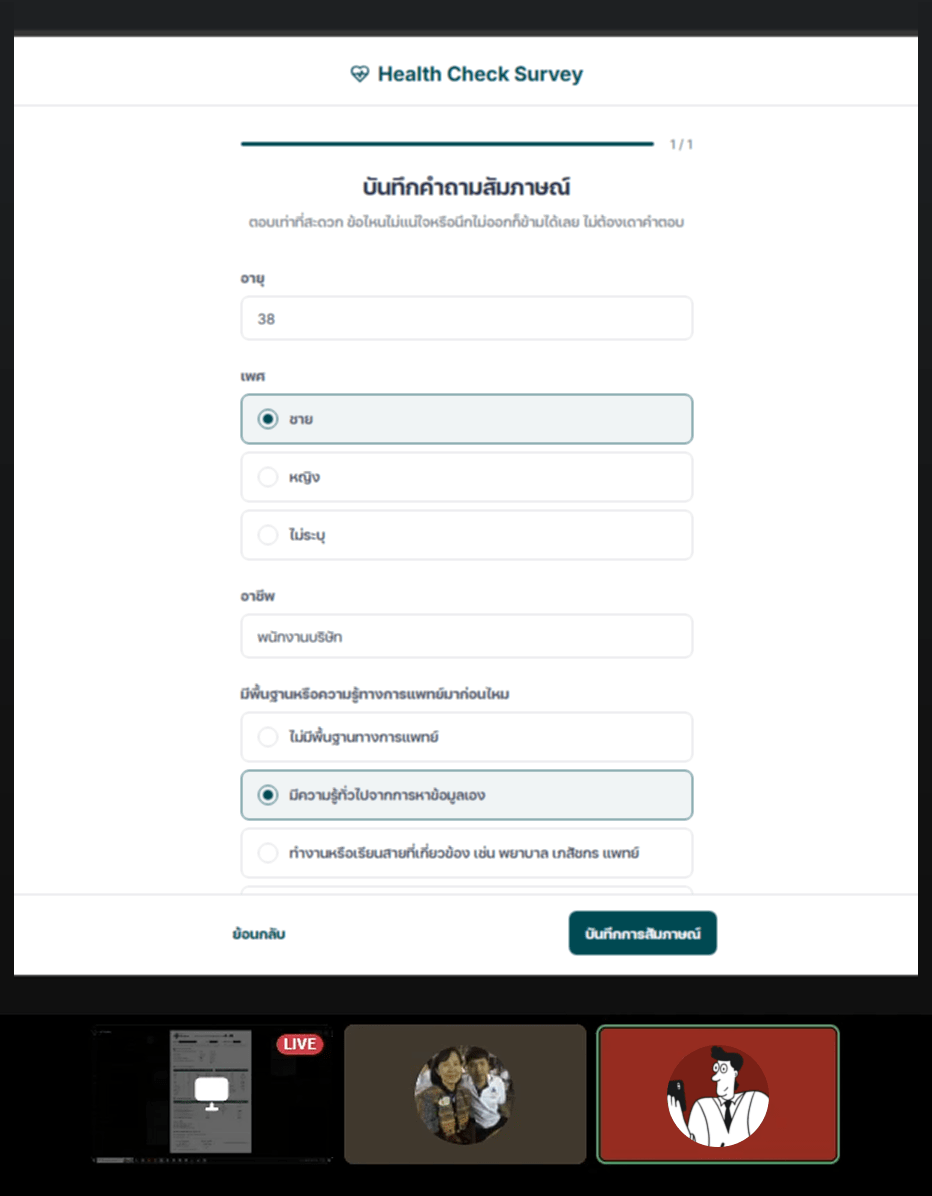
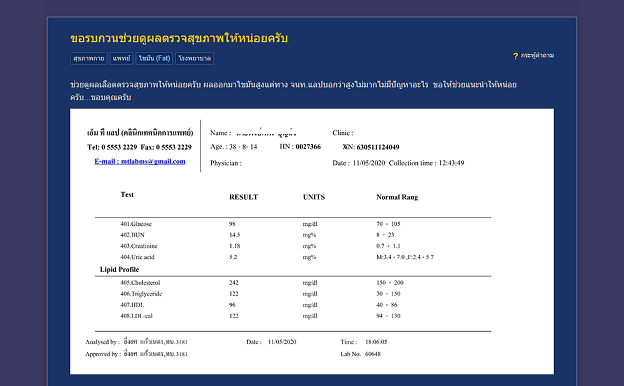
- "Could someone help me look at my blood test results""ช่วยดูผลเลือดตรวจสุขภาพให้หน่อยครับ"
- "Is a result like this normal""ผลตรวจแบบนี้ปกติไหม"
- "My liver value came out like this, what should I do next""พบค่าตับ ผลตรวจออกมาประมาณนี้ ควรทำอย่างไรต่อ"
Across the reports analyzed, the same structural issues appear repeatedly. The problem is not a lack of data, but the lack of hierarchy, explanation, and follow-up support around that data. จากรายงานที่นำมาวิเคราะห์ ปัญหาหลักไม่ได้อยู่ที่ข้อมูลไม่พอ แต่อยู่ที่การจัดลำดับ ความหมาย และการพาผู้ใช้ไปสู่ขั้นตอนถัดไปหลังเห็นผลตรวจ
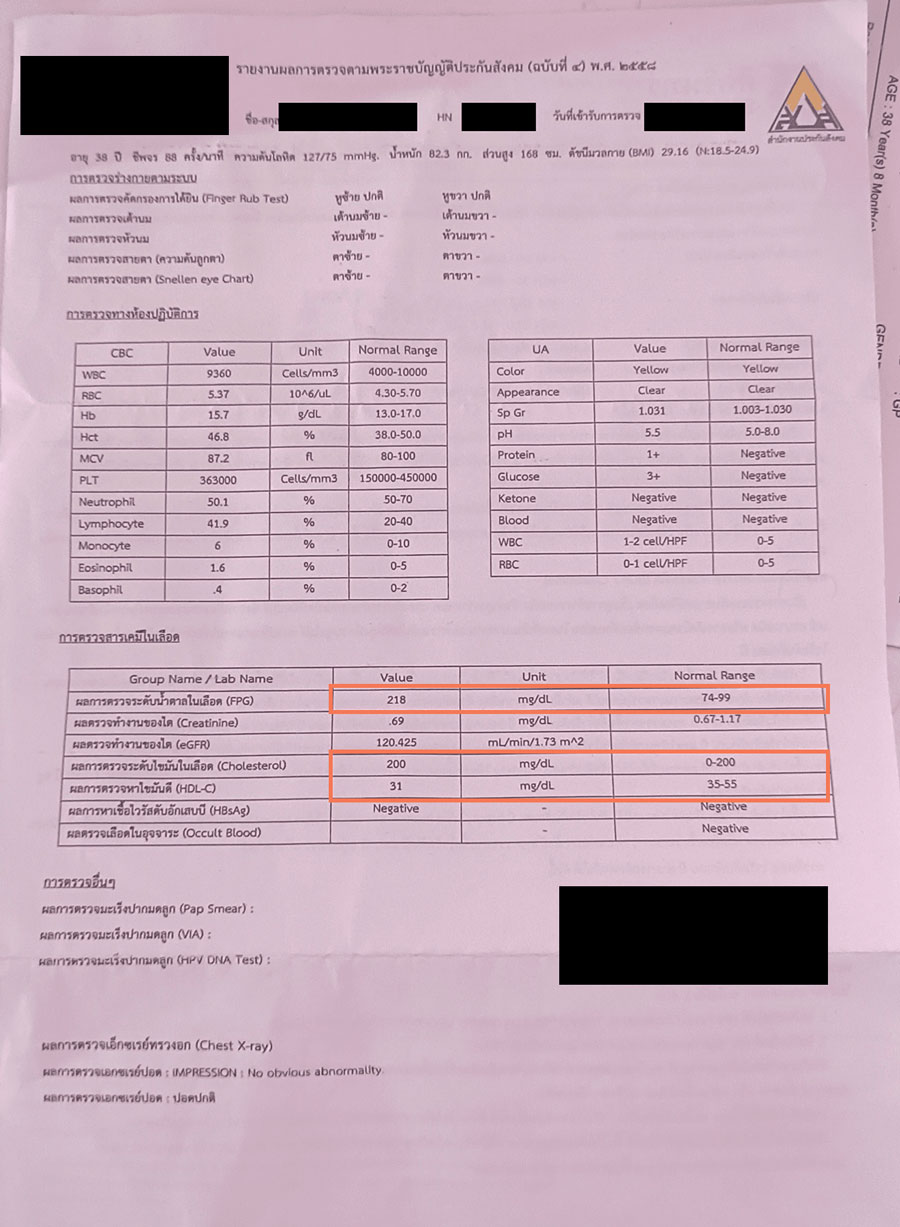
Only a handful of values in the report actually need attention, but the traditional layout gives no indication of where to start looking. Patients end up reading through and comparing every value themselves. ค่าที่ควรให้ความสนใจมีเพียงไม่กี่รายการ แต่รายงานแบบเดิมไม่ได้ช่วยบอกว่าควรเริ่มดูจากจุดใด ผู้ใช้จึงต้องไล่อ่านและเปรียบเทียบค่าทั้งหมดด้วยตนเอง
- FPG is outside the normal rangeFPG อยู่ในช่วงผิดปกติ
- Cholesterol is near the upper edge of the reference rangeCholesterol อยู่ในช่วงใกล้ขอบบนของช่วงอ้างอิง
- HDL-C is below the reference rangeHDL-C อยู่ในช่วงต่ำกว่าเกณฑ์
All three values are shown the same way as every other row, with no emphasis on severity or which ones need attention. Patients have to read through the results and compare them against the reference range (Normal Range) themselves. ทั้ง 3 ค่าแสดงเหมือนรายการอื่น ๆ ไม่มีการบอกระดับความสำคัญหรือชี้ว่าค่าไหนควรระวัง ผู้ใช้จึงต้องไล่อ่านและเทียบกับช่วงอ้างอิงด้วยตัวเอง
The document doesn't clearly say which value is over the limit. I have to compare it against the Normal Range that's attached. เอกสารไม่ได้บอกชัดว่าค่าไหนเกิน ต้องเทียบกับช่วงค่าปกติที่แนบไว้เอง
Interviewee · Female · Age 38ผู้ให้สัมภาษณ์ · เพศหญิง · อายุ 38 ปีI have to go through each value one by one… I don't notice it myself, the doctor is the one who points it out. ก็ต้องไล่ดูทีละค่า... ไม่ได้สังเกตเห็นเอง หมอเป็นคนชี้ให้ดู
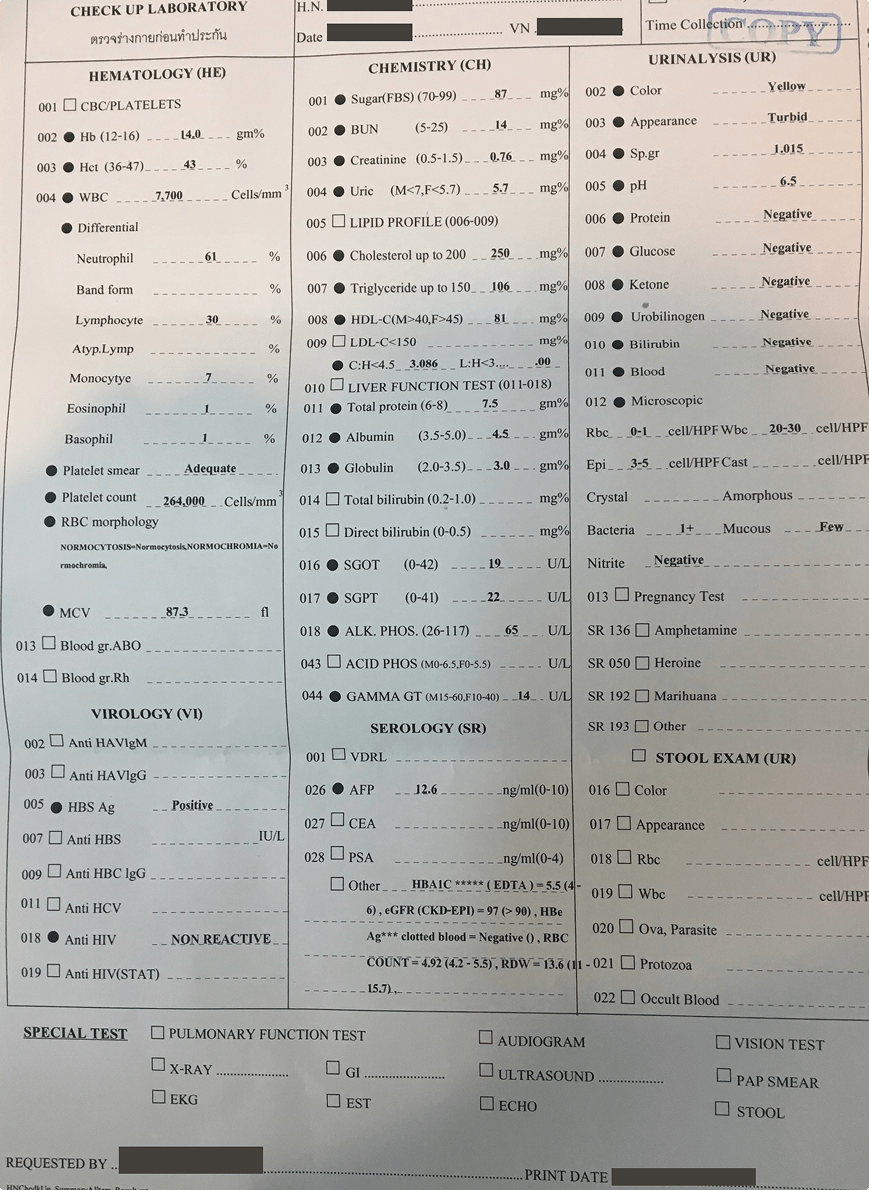
Interviewee · Female · Age 73ผู้ให้สัมภาษณ์ · เพศหญิง · อายุ 73 ปีEven when a value falls outside the reference range, the report doesn't explain what it means, how it affects health, or how significant it is. Patients are left to search for answers themselves or wait for a clinician to explain. รายงานแสดงค่าที่ผิดปกติ แต่ไม่อธิบายความหมาย ผลต่อสุขภาพ หรือระดับความสำคัญ ผู้ใช้จึงต้องค้นหาข้อมูลเองหรือรอให้บุคลากรทางการแพทย์อธิบาย
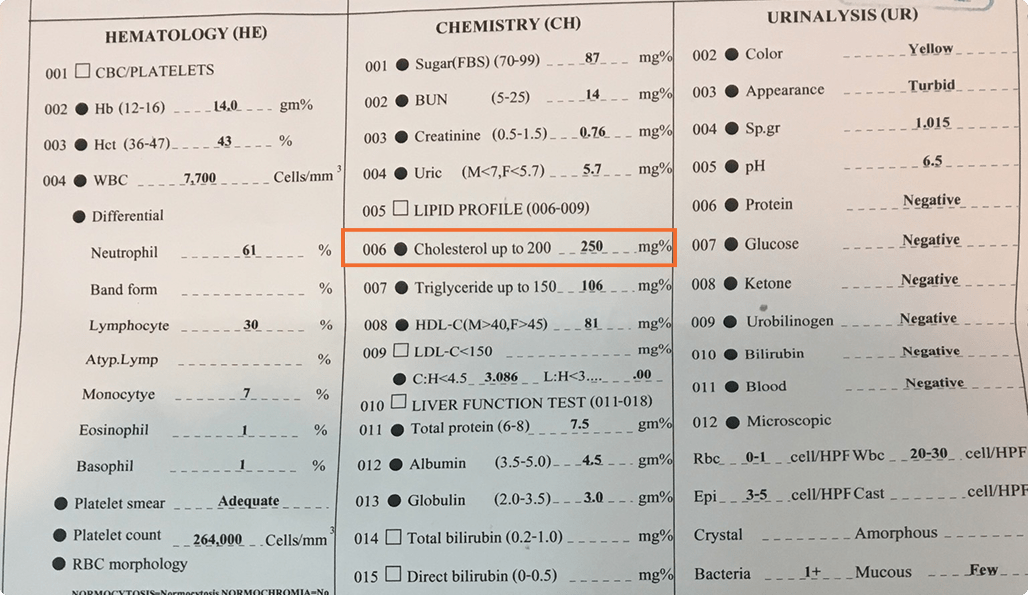
- Cholesterol is 250 mg%, above the reference range of up to 200 mg%คอเลสเตอรอลอยู่ที่ 250 mg% สูงกว่าค่าอ้างอิงที่ไม่เกิน 200 mg%
The value is flagged as above range, but the report doesn't explain what that means or how it affects health, leaving the patient to search for an answer or wait for a clinician. ค่า Cholesterol สูงกว่าช่วงอ้างอิง แต่รายงานไม่ได้อธิบายว่าหมายถึงอะไรหรือส่งผลต่อสุขภาพอย่างไร ผู้ใช้จึงต้องค้นหาข้อมูลเพิ่มเติมเองหรือรอให้แพทย์อธิบาย
I can tell whether it's normal or not, but I still don't know what each value actually means, whether they're related, or which ones I should compare against each other. ก็พอดูได้ว่าปกติไหม แต่ไม่รู้อยู่ดีว่าแต่ละค่ามีความหมายอย่างไร เกี่ยวข้องกันไหม ต้องดูค่าไหนเทียบกันไหม
Interviewee · Male · Age 39ผู้ให้สัมภาษณ์ · เพศชาย · อายุ 39 ปีThe doctor gave an overview and mentioned the fat levels a little, but didn't explain every value. หมอเล่าภาพรวมและเรื่องไขมันนิดหน่อย ไม่ได้อธิบายทุกค่า
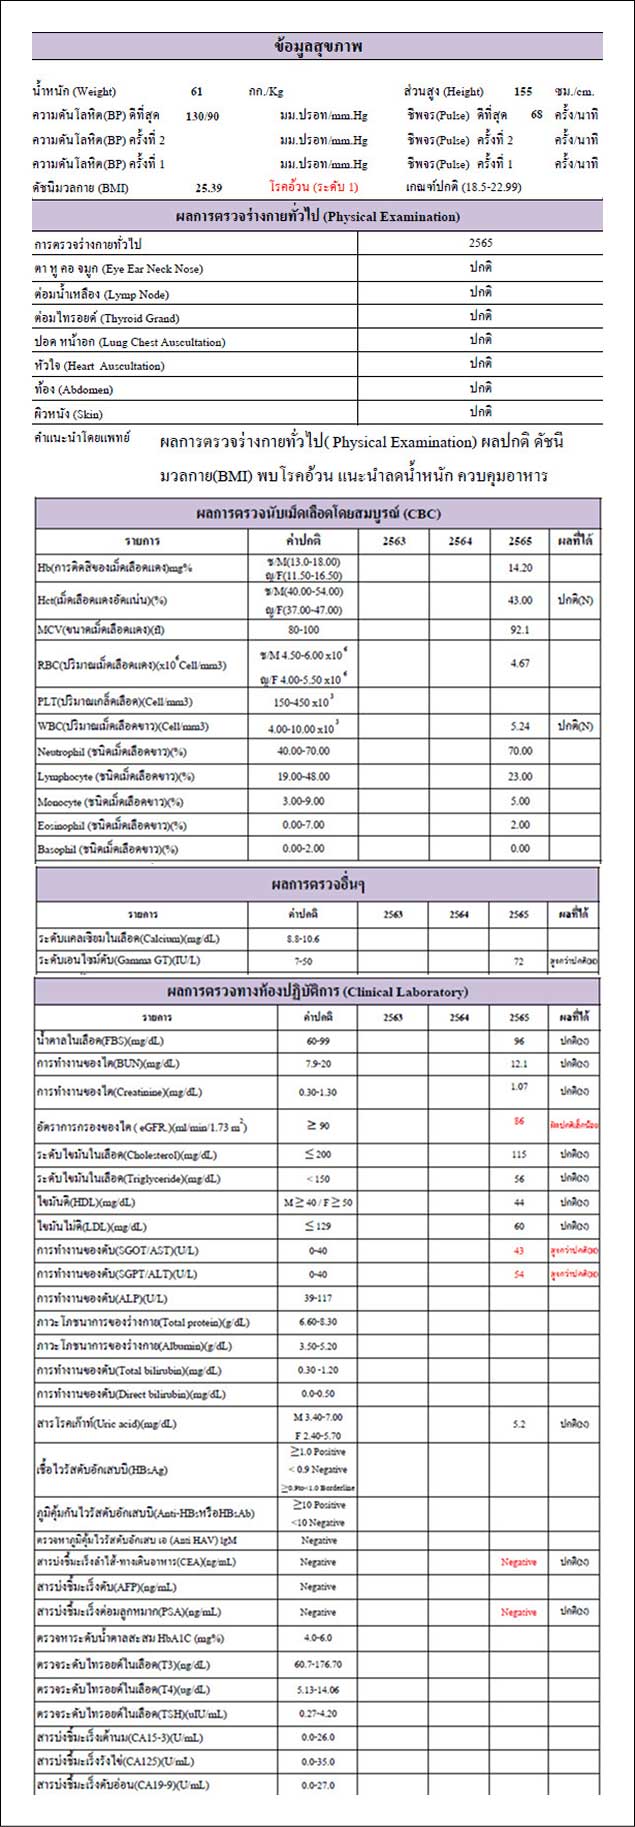
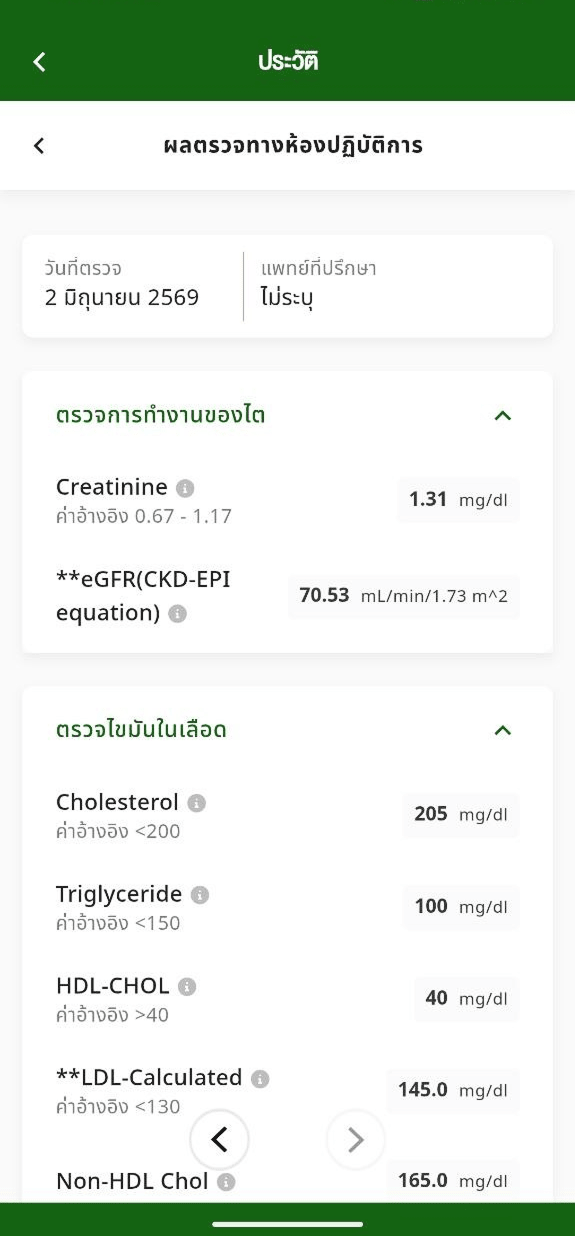
Interviewee · Female · Age 73ผู้ให้สัมภาษณ์ · เพศหญิง · อายุ 73 ปีEven when a term comes with a short explanation, the report still doesn't say what to do next: what to monitor, what to prepare, or what to bring up with a doctor. แม้บางค่าจะมีคำอธิบายศัพท์แนบมาด้วย แต่รายงานก็ยังไม่บอกว่าควรทำอะไรต่อ เช่น ควรเฝ้าระวังเรื่องใด ควรเตรียมตัวอย่างไร หรือควรคุยกับแพทย์เรื่องอะไร
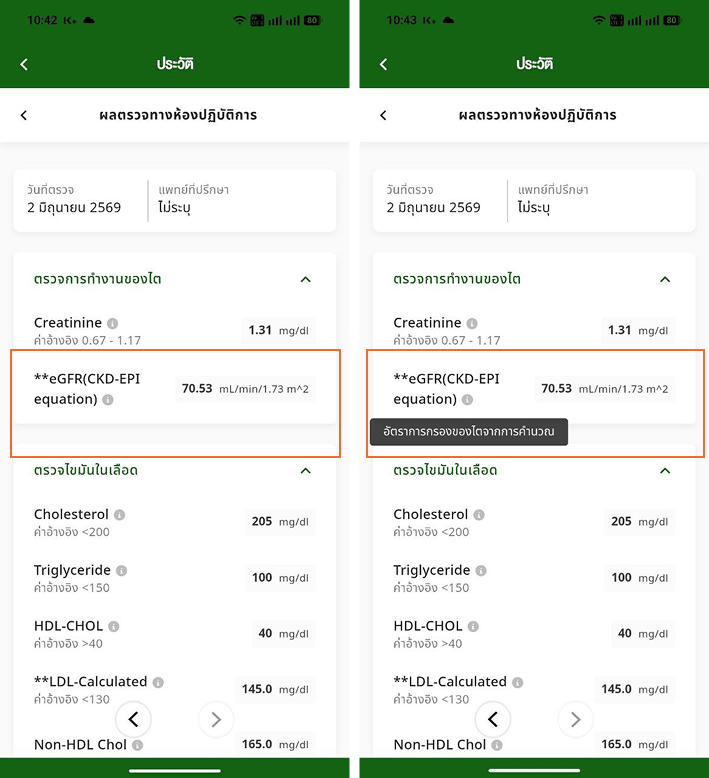
- eGFR(CKD-EPI equation) has a tooltip explaining what the term means, but no guidance on what to do about iteGFR(CKD-EPI equation) มีคำอธิบายศัพท์กำกับไว้ แต่ไม่มีคำแนะนำว่าควรทำอย่างไรต่อ
The term is explained, but the report still doesn't say what the value means for the patient's health or what to do next. คำศัพท์มีคำอธิบายกำกับ แต่รายงานยังไม่บอกว่าค่านี้ส่งผลต่อสุขภาพอย่างไร หรือควรทำอะไรต่อ
I'd like some basic guidance on what to do, so my condition doesn't get worse. อยากได้คำแนะนำเบื้องต้นในการปฏิบัติตน เพื่อไม่ให้อาการแย่ลงจากเดิม
Interviewee · Male · Age 34ผู้ให้สัมภาษณ์ · เพศชาย · อายุ 34 ปีI'd like guidance for daily life, especially what foods I should avoid. อยากได้แนวทางในการใช้ชีวิต โดยเฉพาะเรื่องอาหารที่ควรงด
Interviewee · Female · Age 73ผู้ให้สัมภาษณ์ · เพศหญิง · อายุ 73 ปีEach checkup is read in isolation. The report doesn't show how a value has changed since the last visit, so patients are left to dig up their own old report and compare it by hand. ผลตรวจแต่ละครั้งถูกอ่านแบบแยกเดี่ยว รายงานไม่ได้แสดงว่าค่านั้นเปลี่ยนไปจากครั้งก่อนอย่างไร ผู้ใช้จึงต้องไปหาใบเก่ามาเปรียบเทียบเองด้วยมือ
I ask the doctor or nurse while I'm still there. If I'm already back home and come across something new, I pull out the old report to compare it myself. สอบถามหมอหรือพยาบาล ณ วันนั้น ถ้ากลับจากโรงพยาบาลแล้ว ก็เอาใบเก่ามาเปรียบเทียบ ถ้าเจอข้อมูลใหม่
Interviewee · Female · Age 73ผู้ให้สัมภาษณ์ · เพศหญิง · อายุ 73 ปีInformation is reordered from what the patient should know first toward the full set of reference data, so results are easier to understand without losing any of the underlying medical detail. จัดลำดับข้อมูลใหม่จาก "สิ่งที่ผู้ใช้ควรรู้ก่อน" ไปสู่ "ข้อมูลอ้างอิงทั้งหมด" เพื่อให้เข้าใจผลตรวจได้ง่ายขึ้น โดยไม่สูญเสียข้อมูลทางการแพทย์
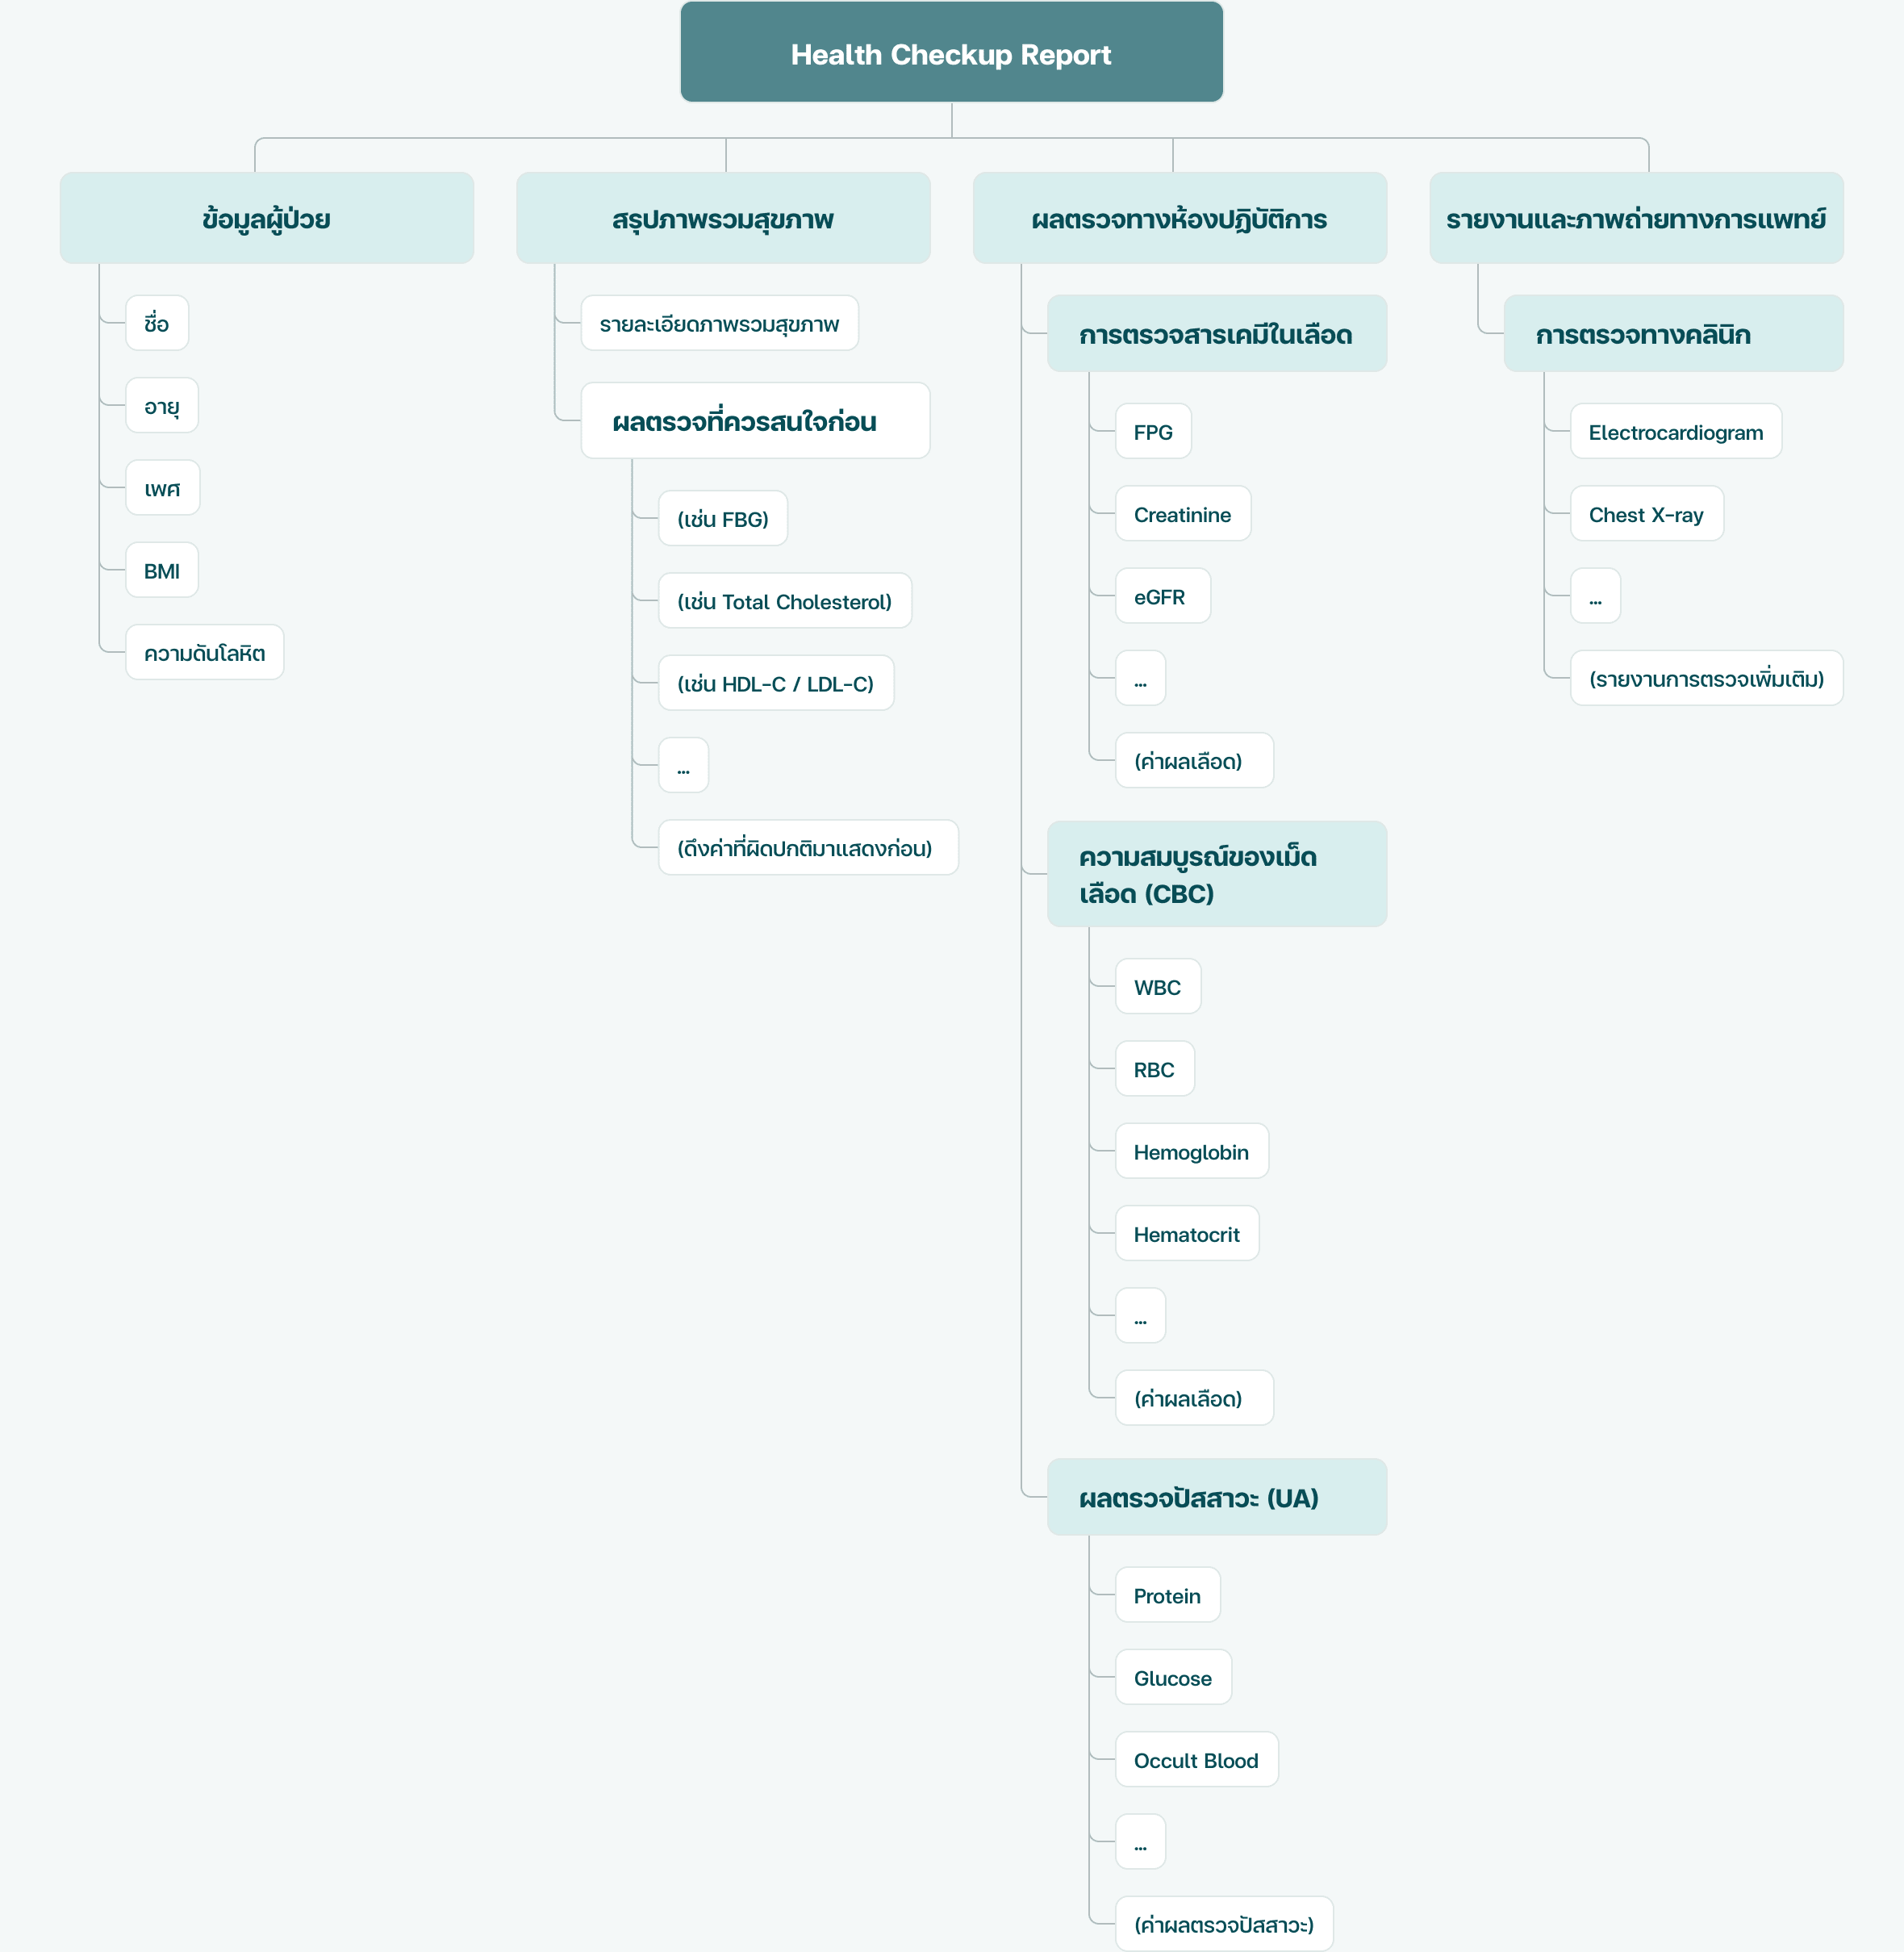
This project redesigns the digital health checkup report around how patients actually read, question, and follow up on their lab results, turning a dense table of values into a clearer experience that supports understanding without diagnosing on a doctor's behalf. หน้ารายงานถูกออกแบบให้เริ่มจากภาพรวมและค่าที่ควรให้ความสนใจก่อน แล้วค่อยพาไปดูคำอธิบาย แนวโน้ม และรายละเอียดฉบับเต็ม เพื่อช่วยให้คนไข้เข้าใจผลตรวจและรู้ว่าควรติดตามอะไรต่อ โดยยังไม่แทนที่การวินิจฉัยหรือคำแนะนำจากแพทย์
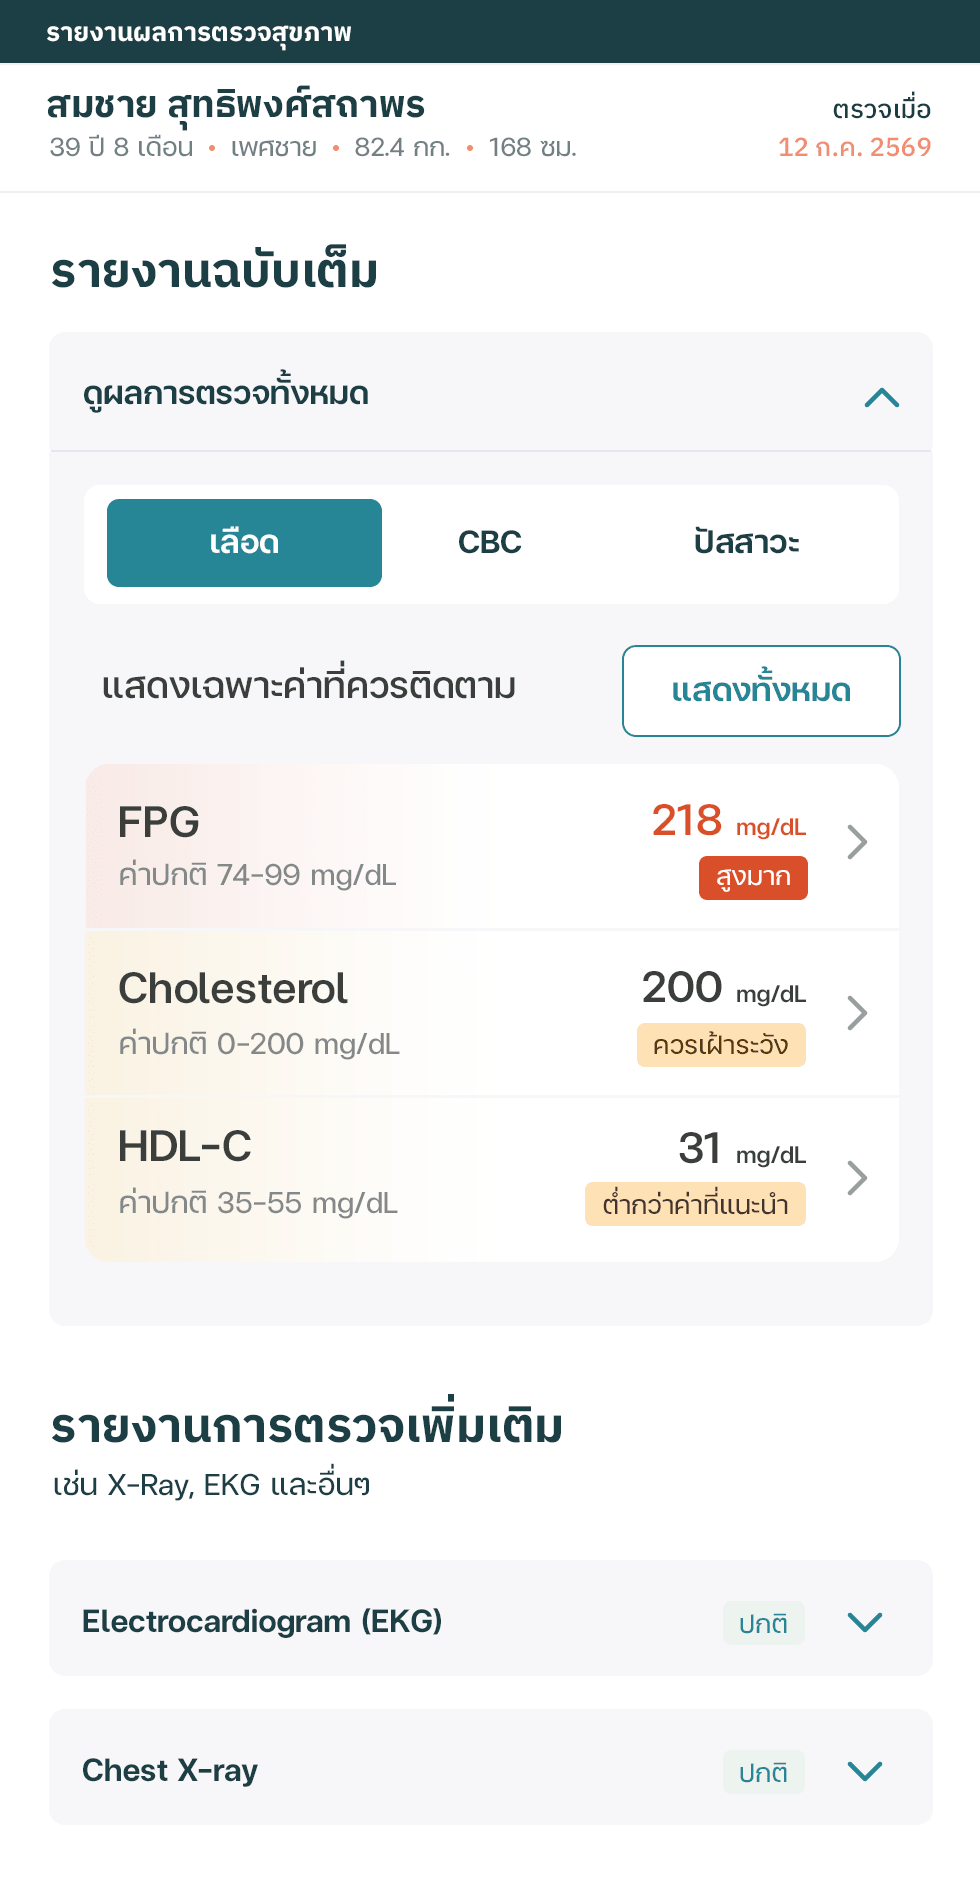
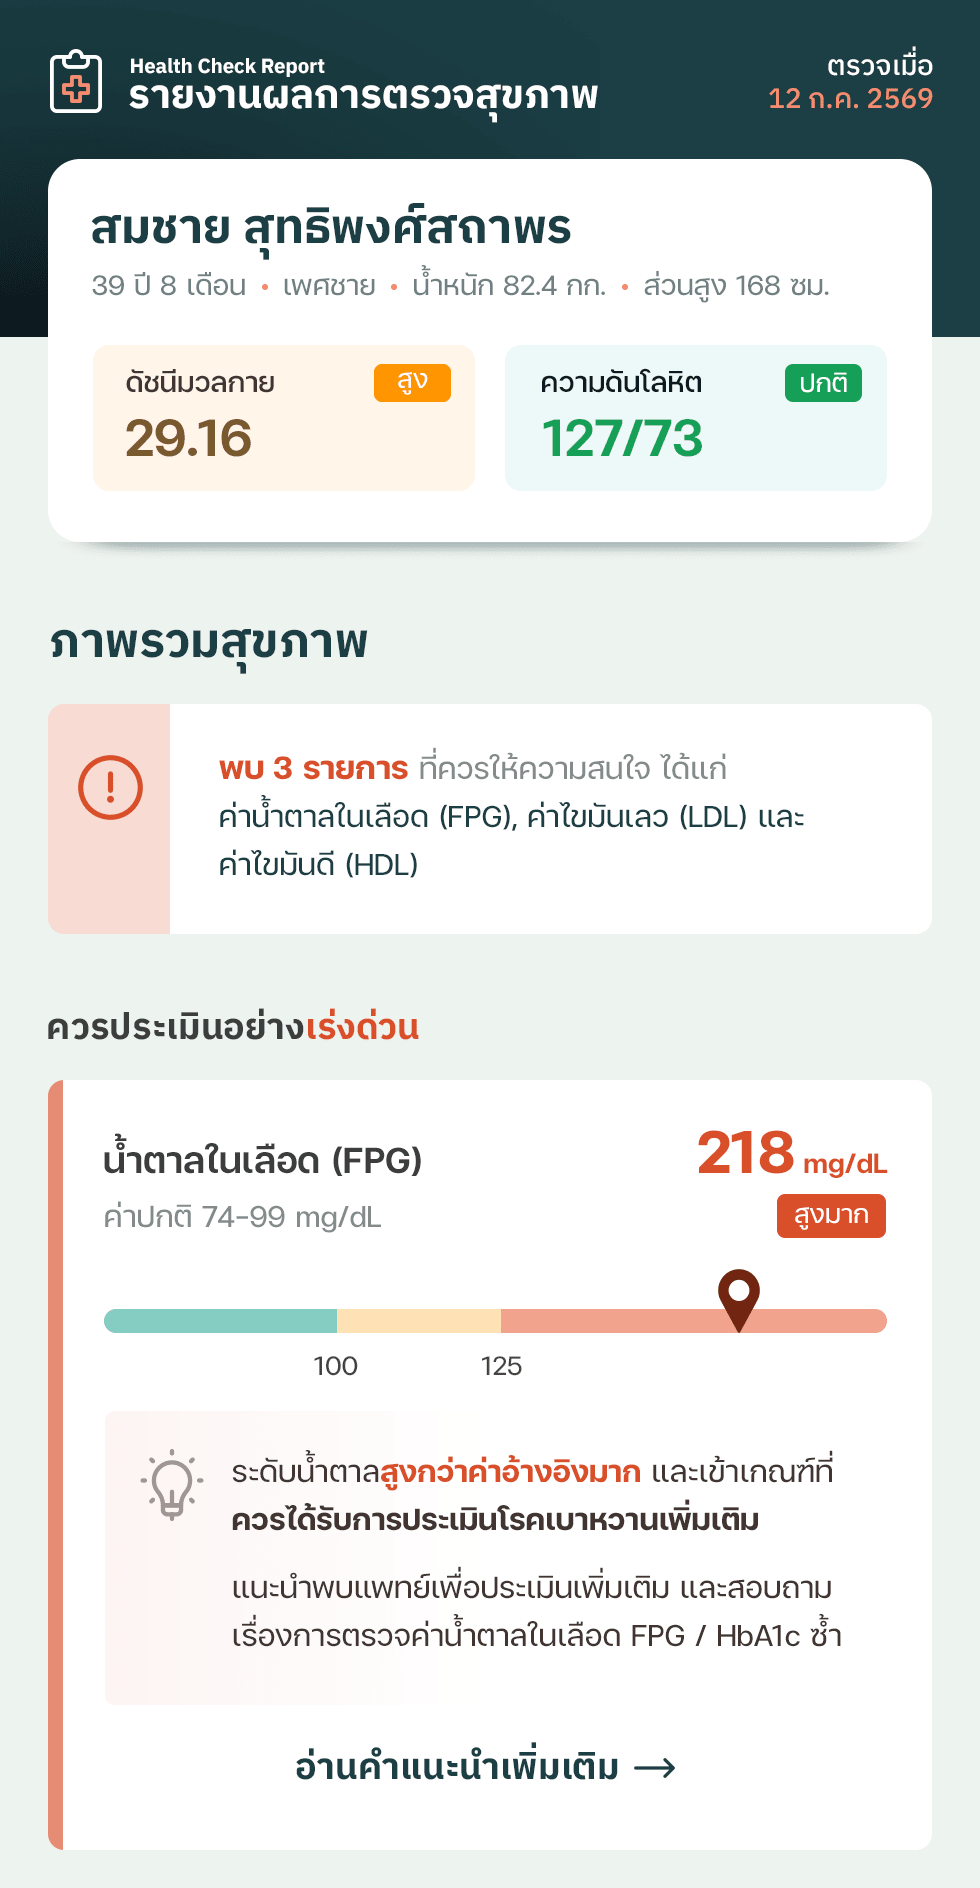
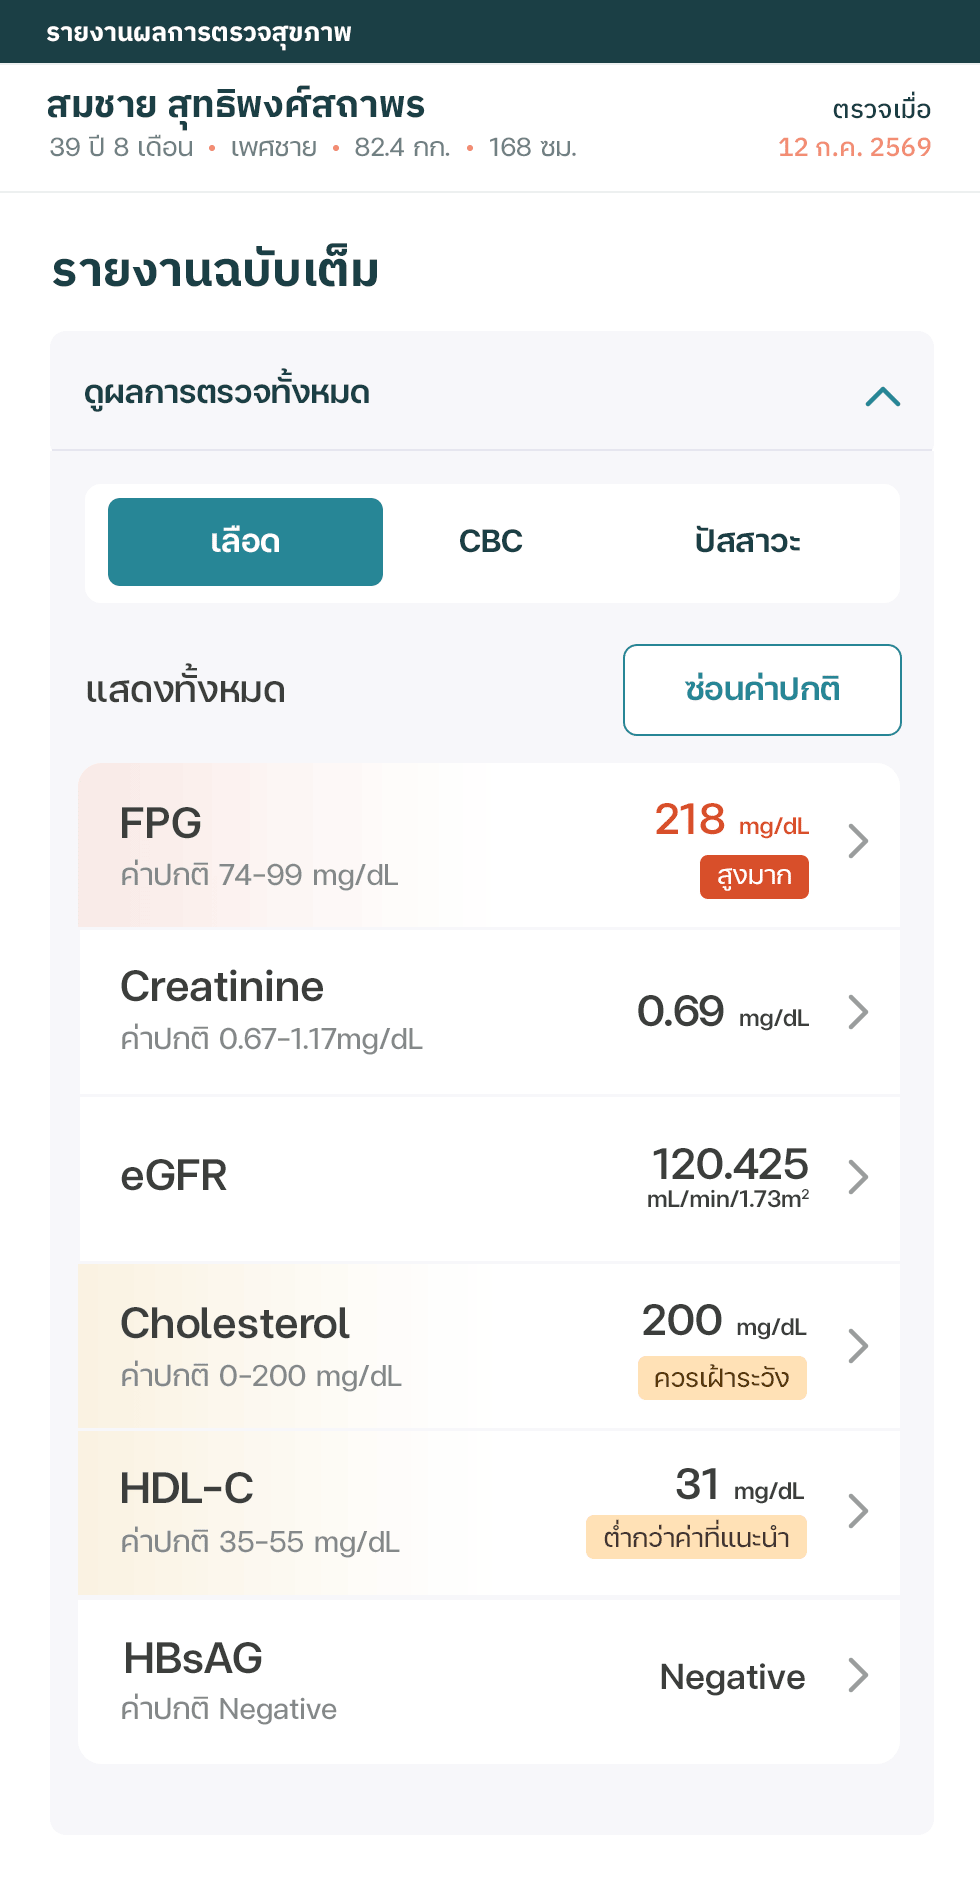
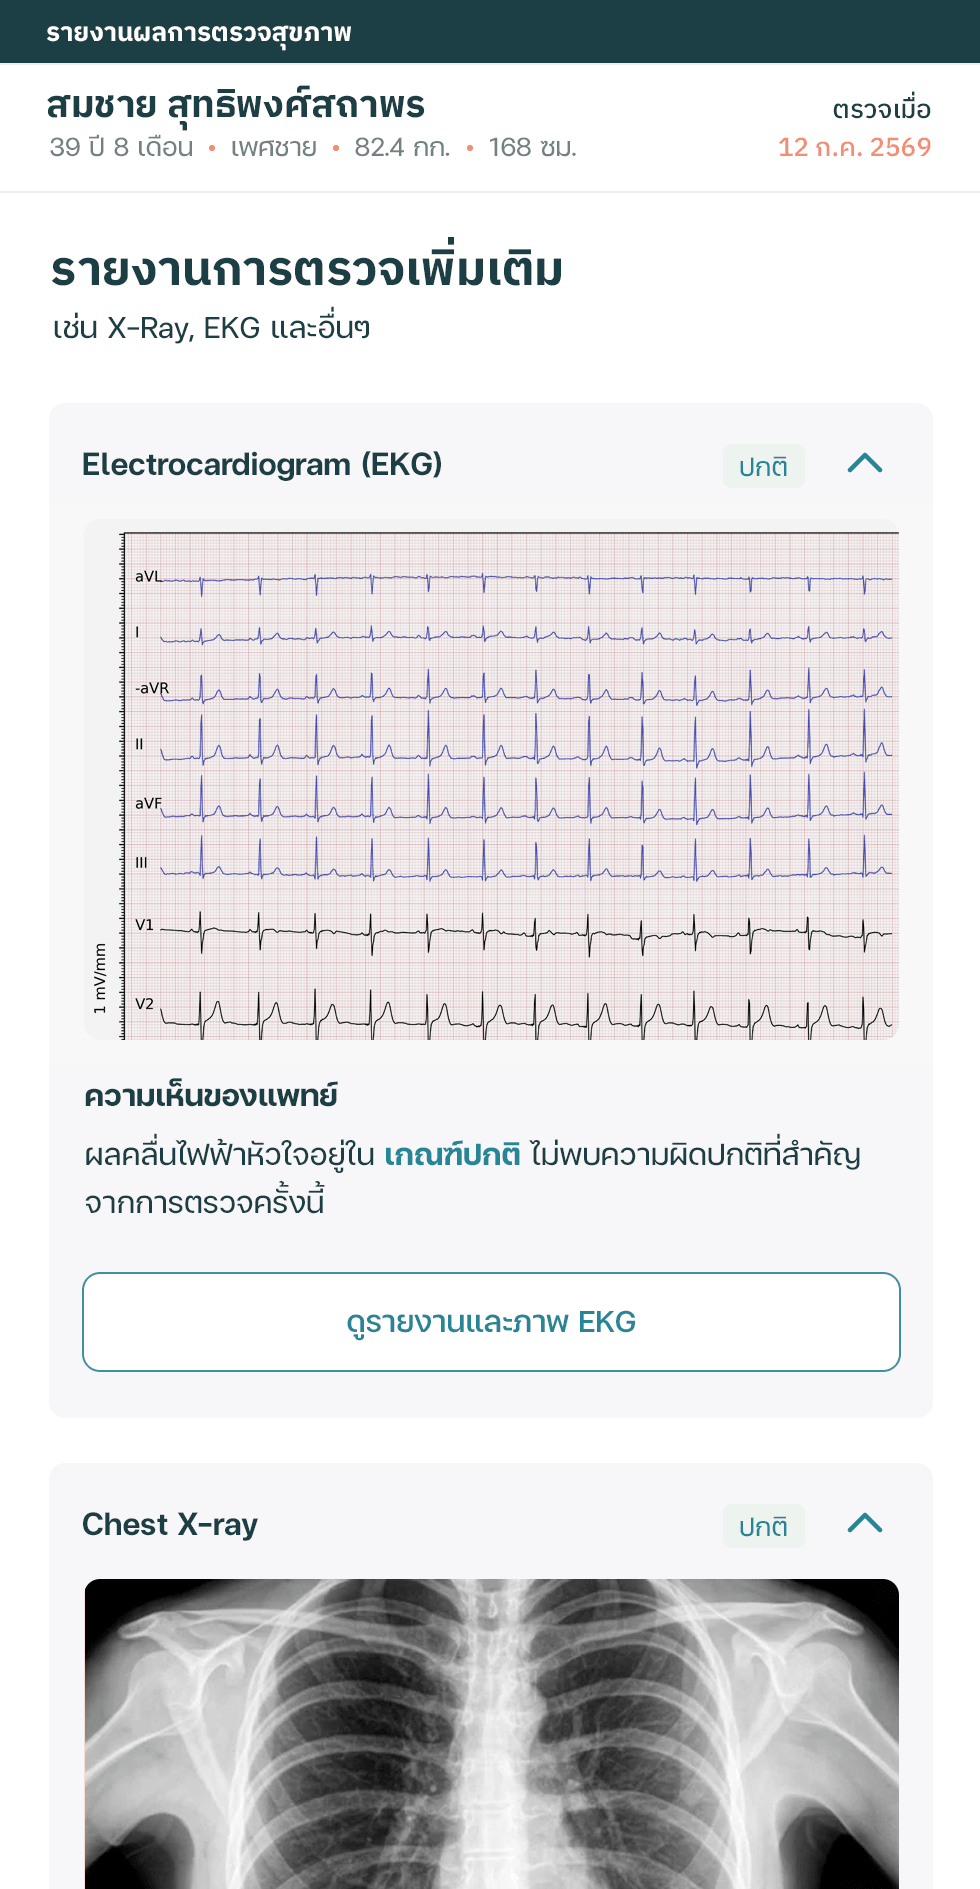
The screens come together in the interactive prototype above. Tap into a finding to see its explanation, or open the full report to filter through every value. ตัวอย่าง Prototype ด้านบนรวมทุกแนวทางไว้ในหน้าจอเดียว ลองแตะผลตรวจแต่ละรายการเพื่อดูคำอธิบายเพิ่มเติม หรือเปิดรายงานฉบับเต็มเพื่อกรองดูค่าต่าง ๆ ได้
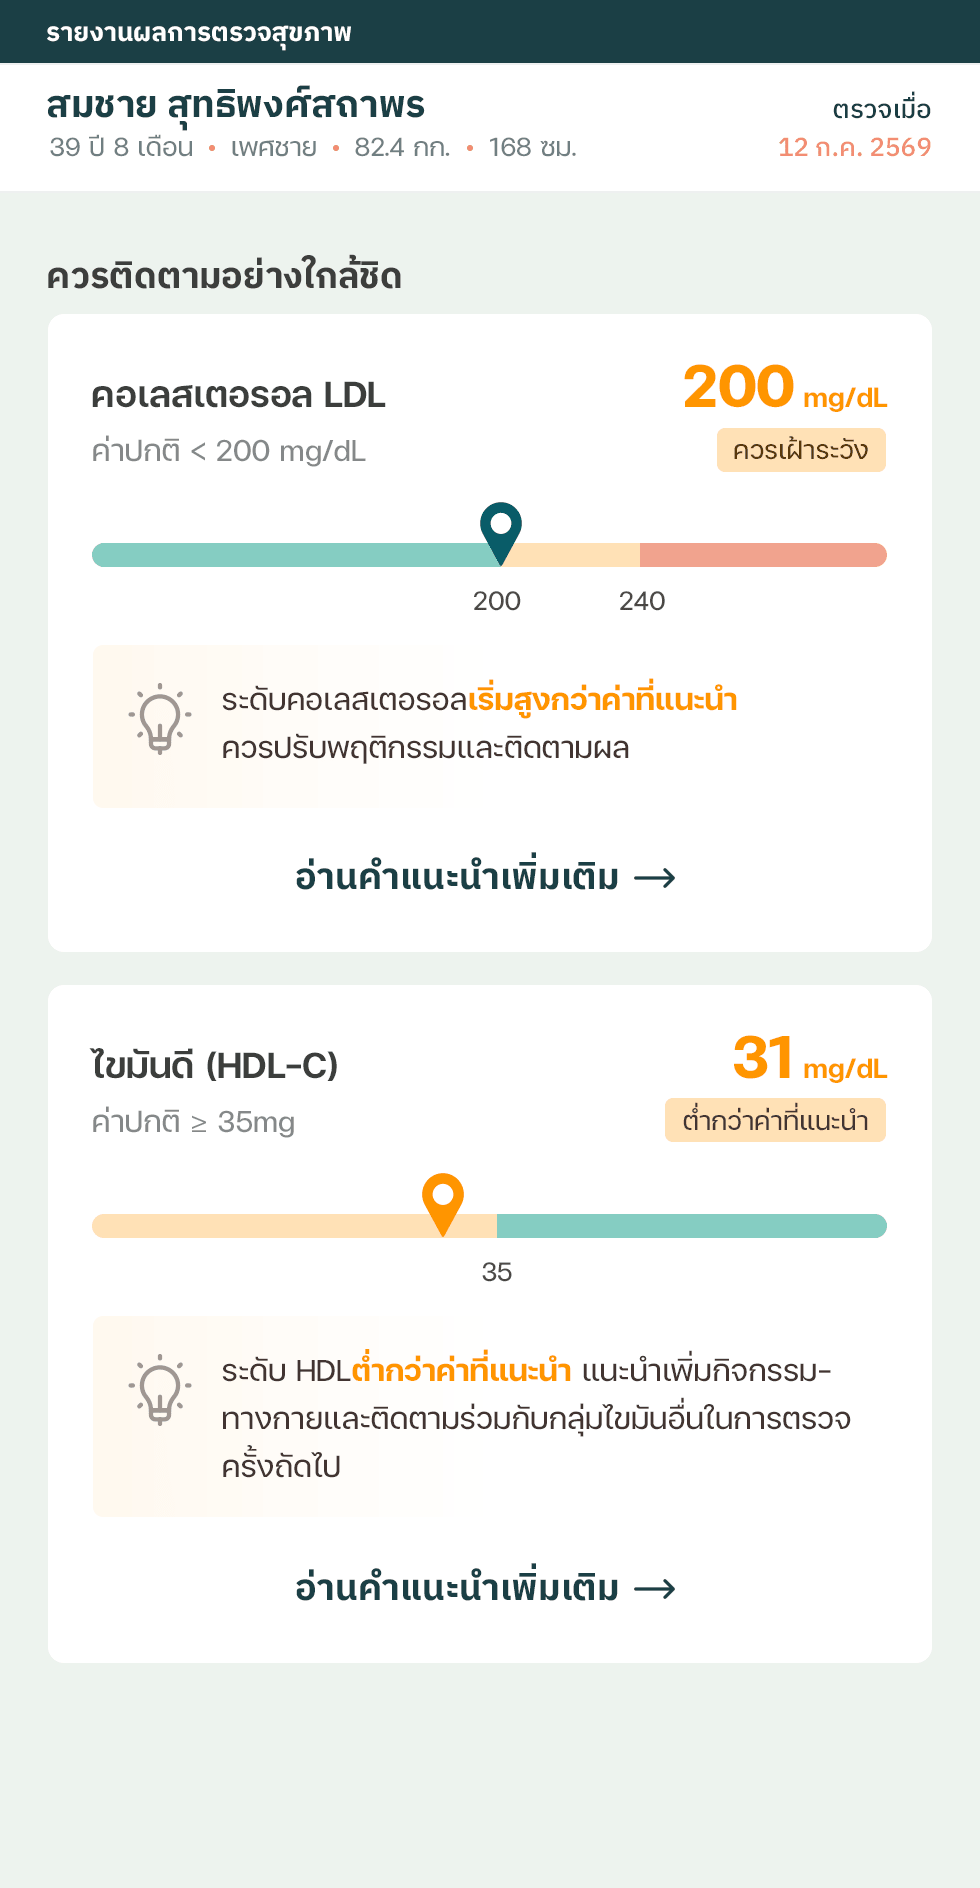
Instead of making patients scan the full lab table first, the report starts with the results most likely to affect this case. Findings are split by urgency: values that should be reviewed first are shown with stronger emphasis, while lower-risk values remain visible as items to monitor rather than disappearing into the full report. แทนที่จะให้ผู้ใช้เริ่มจากตารางผลตรวจทั้งหมด รายงานดึงค่าที่ส่งผลกับเคสนี้มากที่สุดขึ้นมาให้เห็นก่อน แล้วแบ่งผลตรวจตามความเร่งด่วน ค่าที่ควรถูกประเมินก่อนจะถูกเน้นให้เด่นกว่า ส่วนค่าที่ความเสี่ยงรองลงมาก็ยังแสดงไว้ในกลุ่มที่ควรติดตาม ไม่ถูกซ่อนไปอยู่ในรายงานฉบับเต็มอย่างเดียว
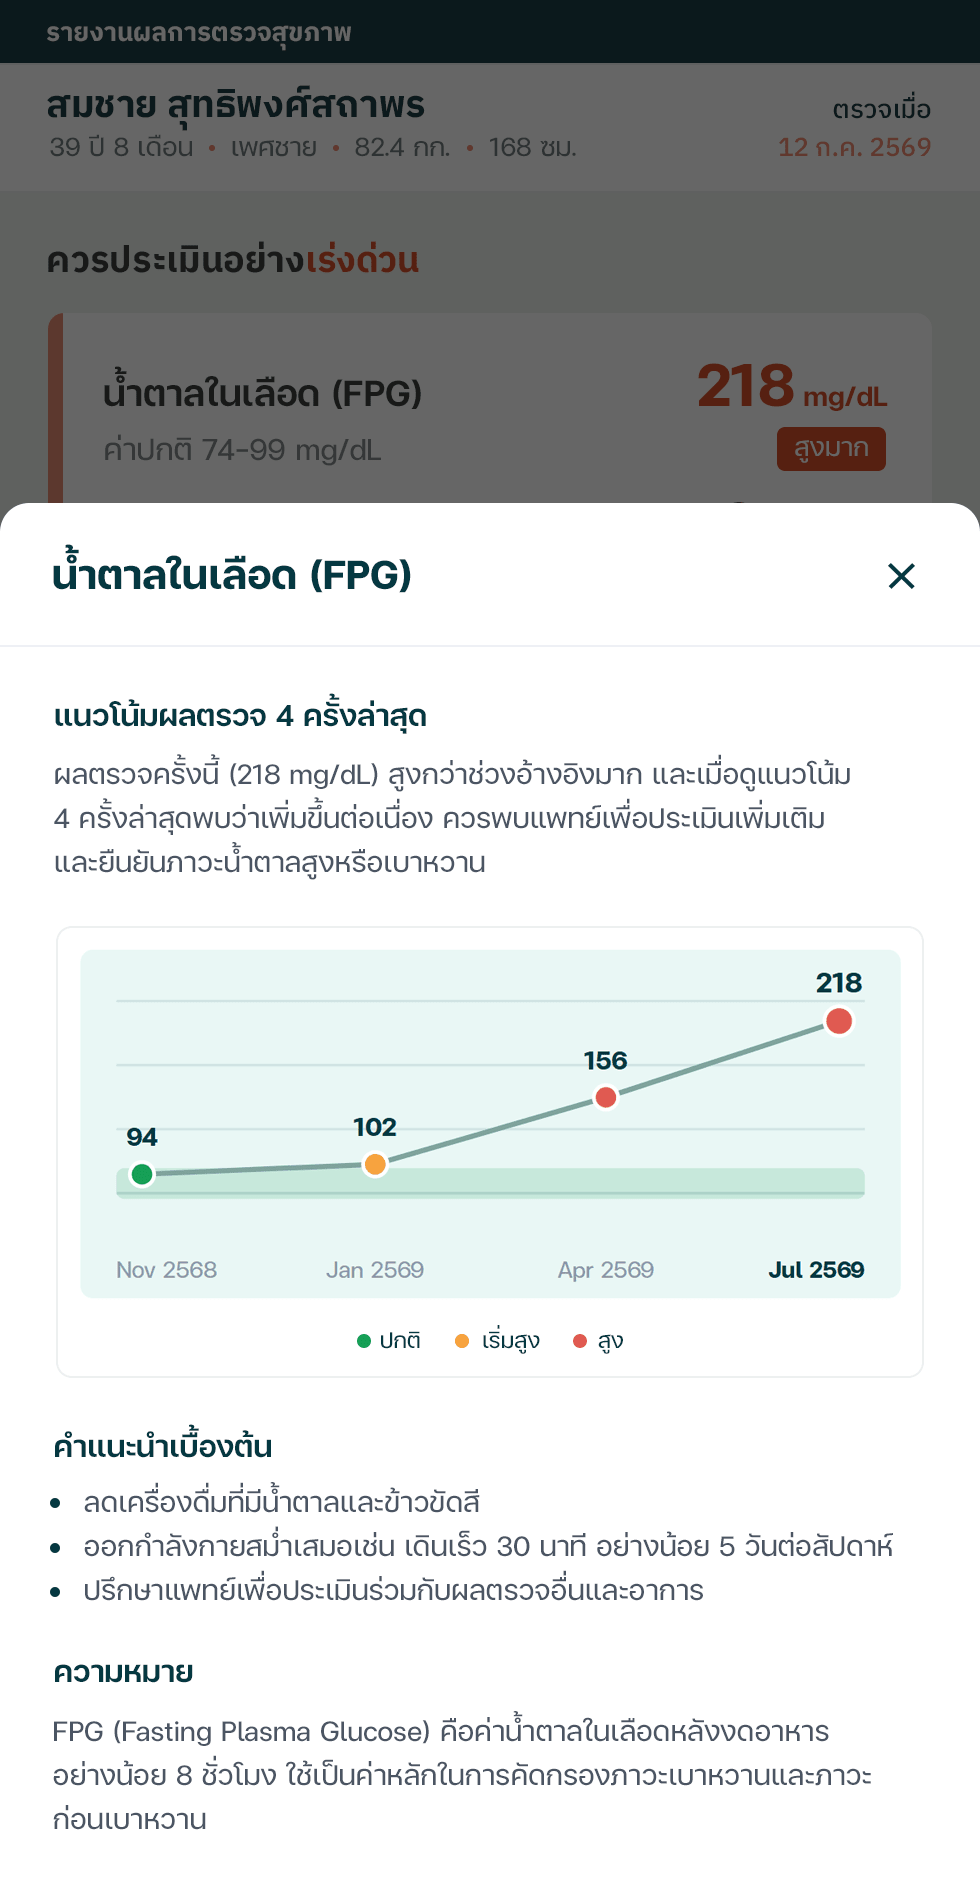
When a patient taps into a finding, a bottom sheet explains what the value means, what it may relate to, which related values to check, and what initial questions or actions to prepare before talking with a clinician. เมื่อแตะผลตรวจแต่ละรายการ จะมีป๊อปอัปเปิดขึ้นมาเพื่อสรุปแนวโน้มจากการตรวจครั้งก่อน ๆ อธิบายว่าค่านั้นหมายถึงอะไร อาจเกี่ยวข้องกับปัจจัยใด และควรเตรียมคำถามหรือดูแลตัวเองเบื้องต้นอย่างไรก่อนคุยกับแพทย์
Every value from the lab report is still available, organized by test group and filterable to only the ones outside the normal range, so the complete report isn't lost, just not the first thing the patient has to read. ค่าตรวจทั้งหมดจากใบแล็บยังอยู่ครบ จัดกลุ่มตามประเภทการตรวจ และกรองดูเฉพาะค่าที่ผิดปกติได้ รายงานฉบับเต็มจึงไม่หายไปไหน เพียงแต่ไม่ถูกวางเป็นสิ่งแรกที่คนไข้ต้องอ่าน
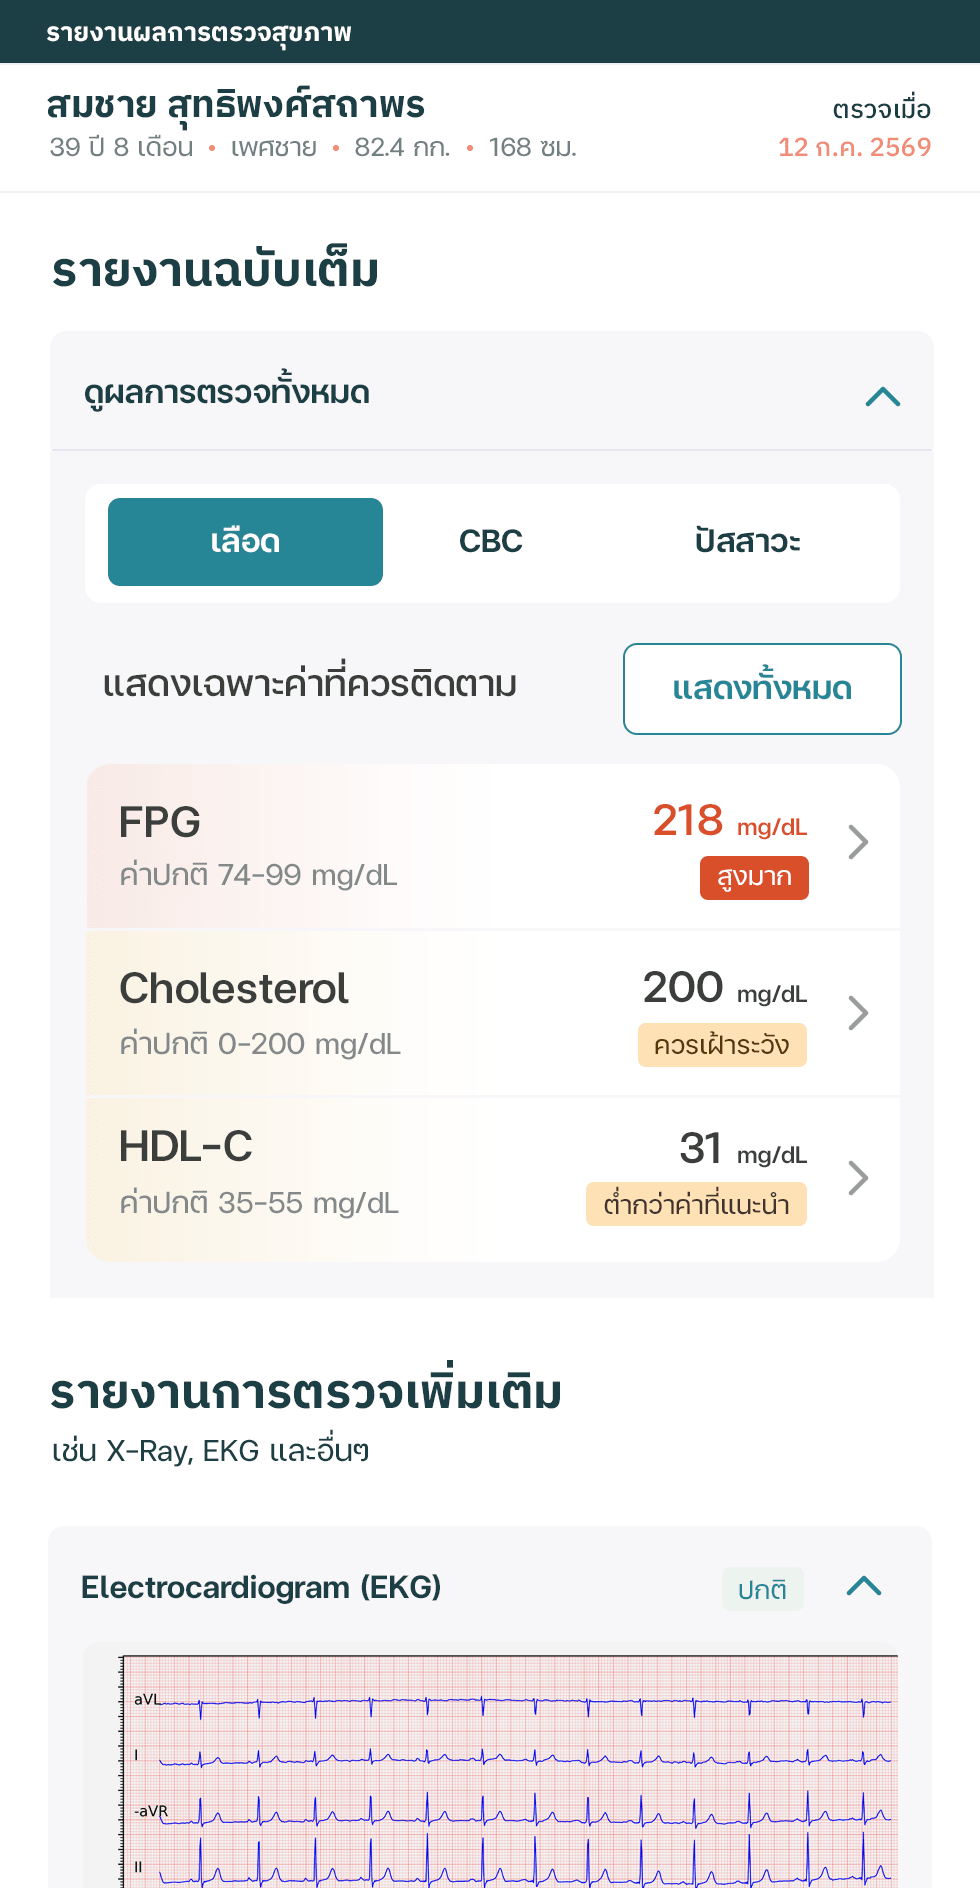
EKG and X-ray results sit in their own collapsible cards with the doctor's note attached, separated from the blood and urine panels so different types of results don't get read as one long undifferentiated list. ผลตรวจอย่าง EKG และ X-ray แยกเป็นการ์ดของตัวเอง พร้อมความเห็นของแพทย์ เพื่อไม่ให้ผลเลือด ปัสสาวะ และผลภาพถ่ายถูกรวมเป็นรายการยาวชุดเดียว